Loading Dashboards & Data Visualization...
Please wait while we prepare your dashboards and visualization content.
Please wait while we prepare your dashboards and visualization content.
We design and develop real-time dashboards that integrate with APIs, databases, and analytics tools to give you actionable insights at a glance.
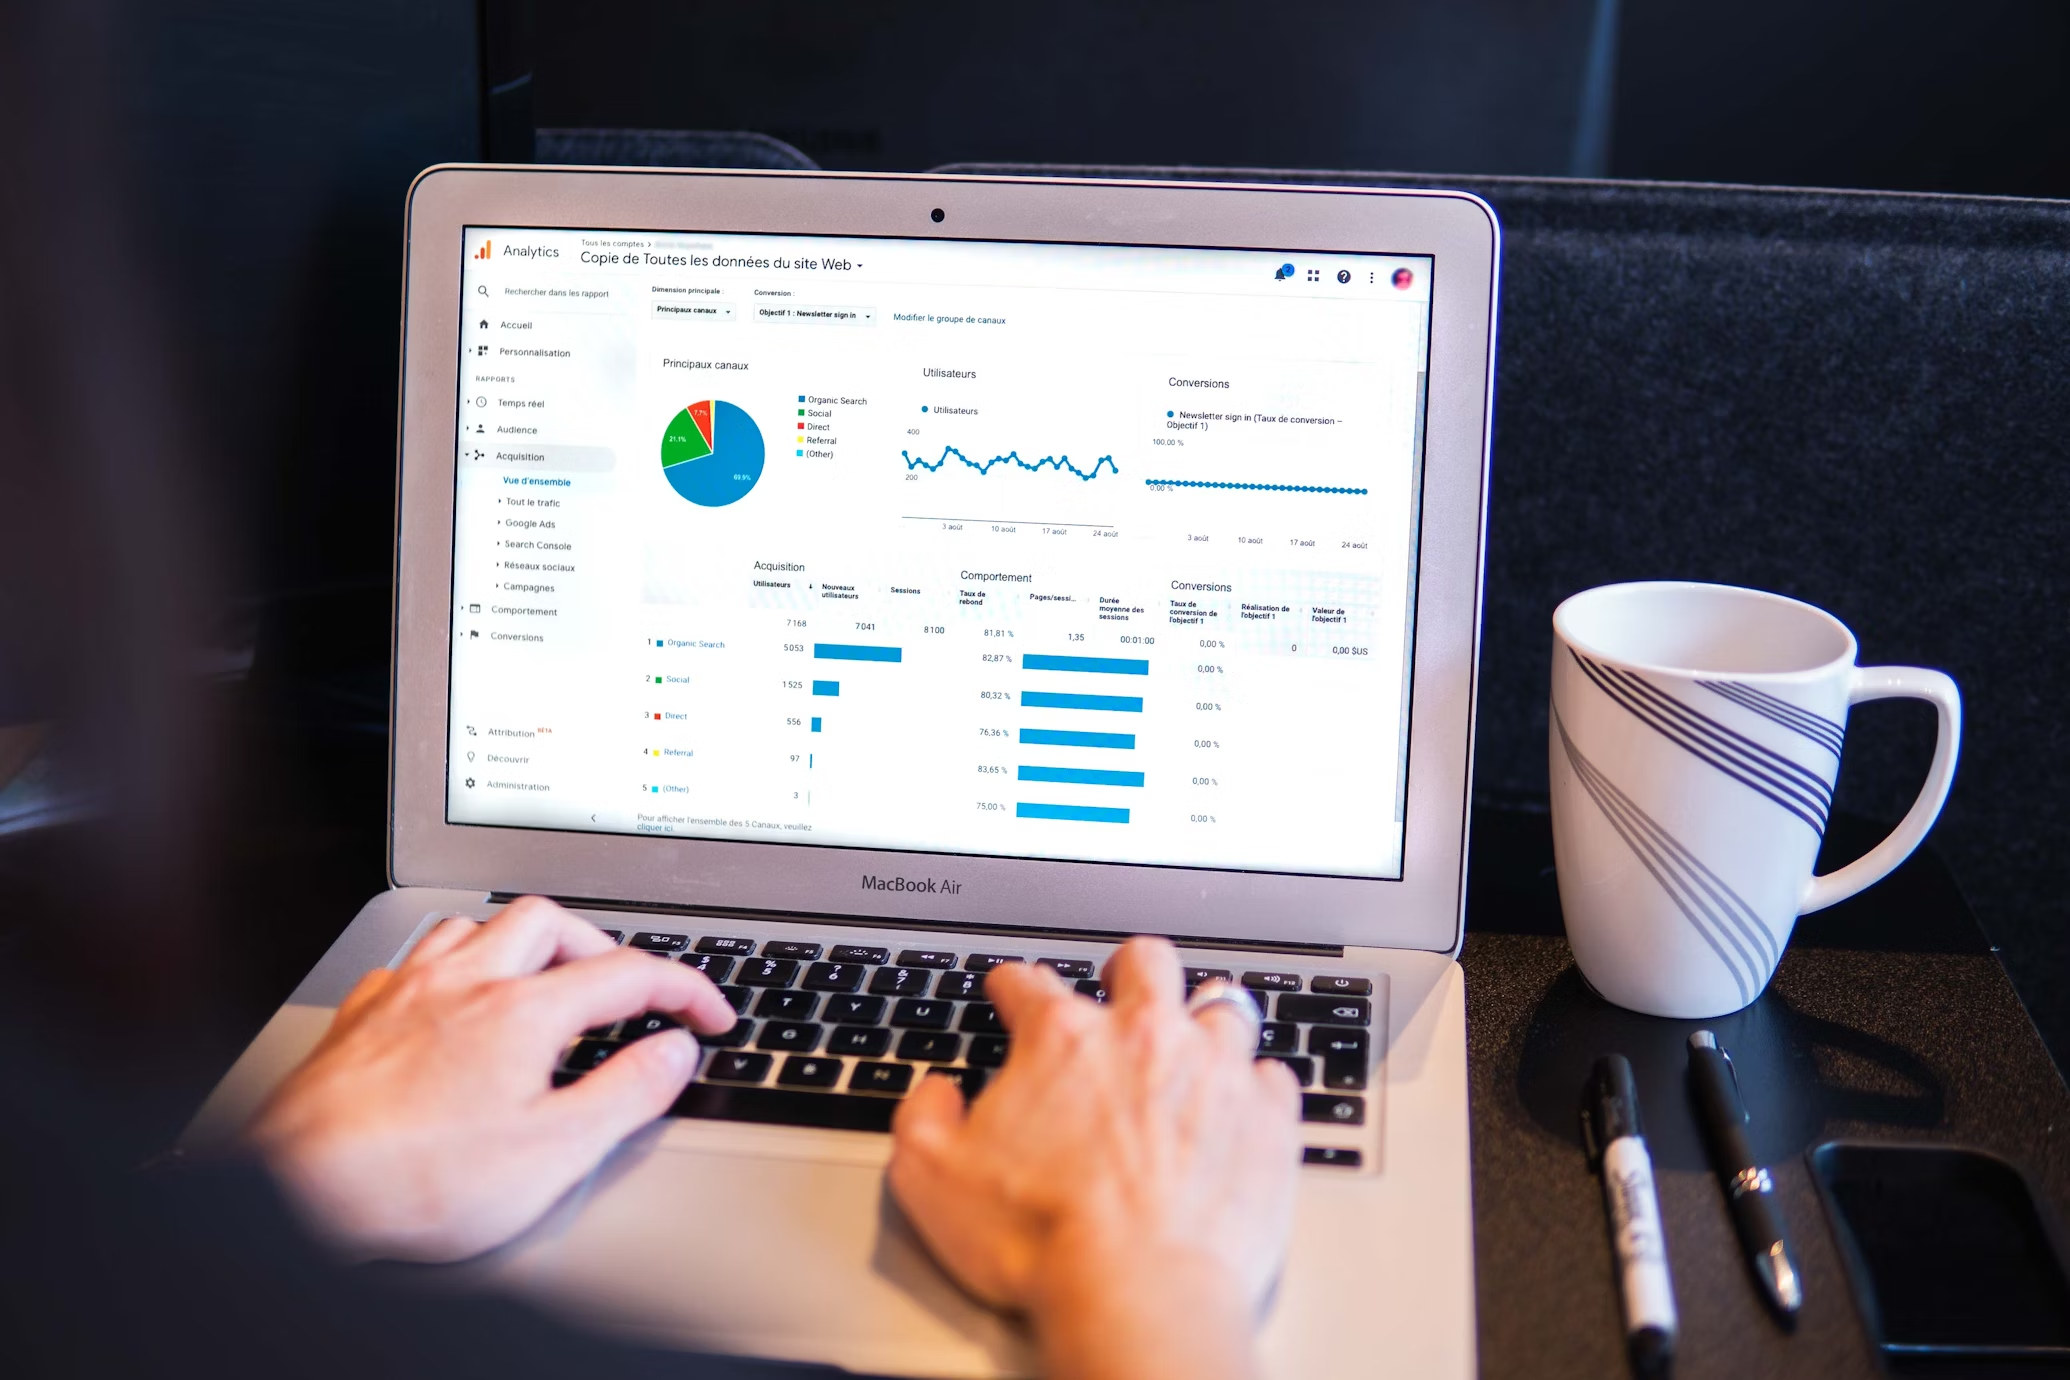
From real-time analytics to business intelligence dashboards, we create powerful data visualization solutions that drive insights and decision-making.
Live data visualization with real-time updates, interactive charts, and customizable widgets for instant insights.
Seamless integration with Google Analytics, Mixpanel, Amplitude, and other analytics platforms for comprehensive data views.
Connect to multiple data sources, APIs, and databases to create unified dashboards with consolidated information.
Mobile-first dashboard design that works perfectly across all devices with touch-friendly interactions.
Tailored charts, graphs, and data representations designed specifically for your business metrics and KPIs.
Role-based access control, data security, and user permissions to ensure sensitive information is protected.
Custom dashboard solutions tailored to your specific business needs and data requirements.
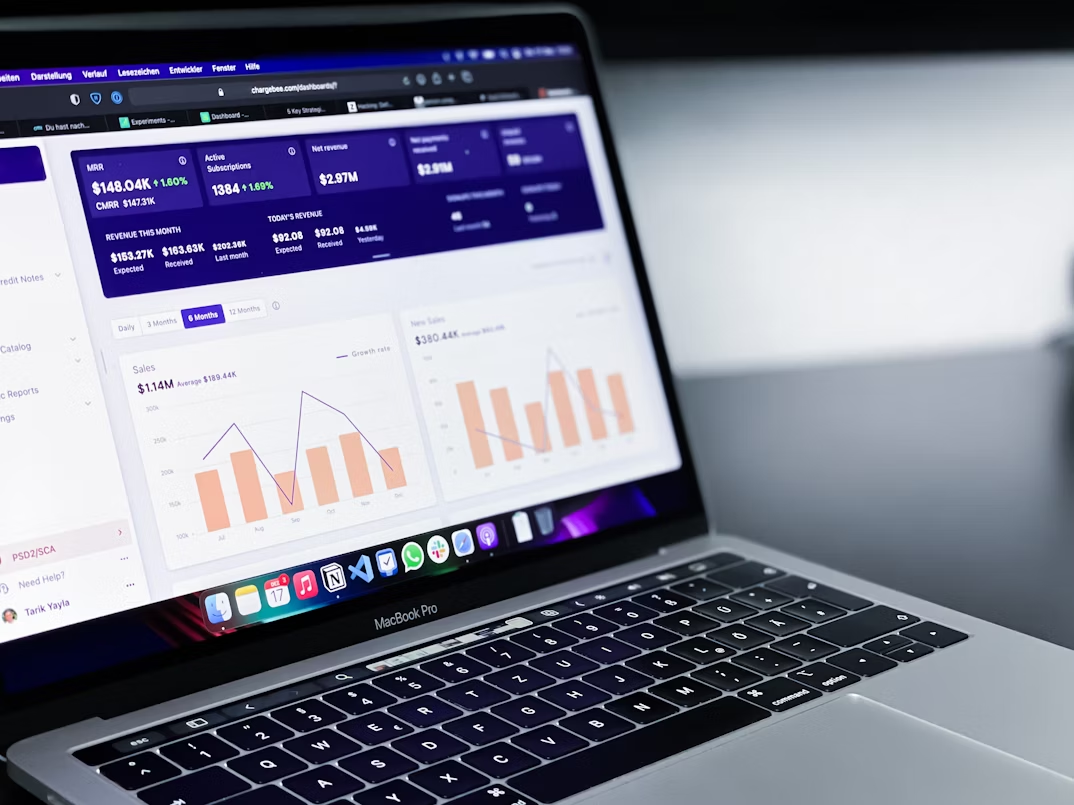
Executive dashboards with high-level KPIs, performance metrics, and strategic insights for decision-making.
Detailed analytics dashboards with user behavior, conversion tracking, and marketing performance metrics.
Real-time operational dashboards for monitoring system performance, alerts, and operational metrics.
We follow a proven methodology to ensure your dashboard is delivered with optimal performance and user experience.
Analyzing your data sources, metrics, and reporting requirements to design the optimal dashboard structure.
Creating intuitive dashboard designs with clear data hierarchy, interactive elements, and user-friendly navigation.
Connecting multiple data sources, APIs, and databases to provide real-time data visualization.
Building custom charts, graphs, and interactive elements using modern visualization libraries and frameworks.
Performance testing, data accuracy validation, and user experience optimization for optimal dashboard performance.
User training, documentation, and ongoing support to ensure successful dashboard adoption and usage.
Why invest in custom dashboard solutions for your business data visualization needs.
Make informed decisions with real-time data visualization and comprehensive business insights.
Streamline reporting processes and reduce time spent on manual data analysis and report generation.
Monitor key metrics and performance indicators in real-time with instant alerts and notifications.
Tailored dashboards that provide insights specific to your business needs and industry requirements.
We use the latest data visualization technologies and frameworks to build powerful, interactive dashboards.
Data visualization
Chart library
Frontend framework
Progressive framework
Backend runtime
Data processing
Database
Caching
Custom dashboards provide tailored data visualization that generic solutions cannot match. Our dashboards are designed specifically for your business metrics, KPIs, and decision-making processes, ensuring maximum value and insights.
Let's discuss your data visualization needs and create powerful dashboards that provide actionable insights for your business.
Get in Touch:
info@athenasols.comBusiness Development:
sales@athenasols.com